Pages: << 1 2 3 4 5 ...6 ...7 8 9 10 11 12 ... 19 >>
10/30/08
Evolution of a Kanban board
In No More Iterations I showed our 1st attempt at a kanban board. Now that we have a little more experience I'd like to show you where we are now and where we stopped on the way.
|
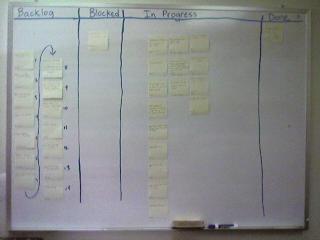
Here is where we started. Columns for backlog, blocked, in progress and done. Notice the large number of items "in-progress" even though there are only 7 people on the team (can you say multi-tasking?). In fact this was pointing to the fact that developers were building stuff faster than QA could consume it. One bottleneck identified. |
 |
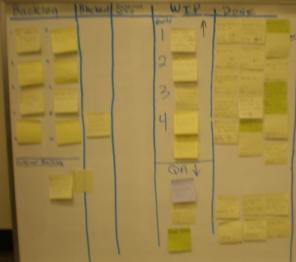 |
Here is the same board a few weeks later. Note the new column for blocked work in process (WIP) and that the number of in process stories has been reduced significantly. The number of completed stories increased dramatically. We accomplished this by focusing on getting stories done rather than just doing "work". That meant of course that programmers helped out with QA type tasks. It also meant that programmers had time to do some of the environmental cleanup activities that everyone always wants to do, but never has time to do them. Turns out we had time, we were just covering it up with other work An interesting side effect was that developers were not used to having "idle" time and this was very disconcerting for many weeks. It seemed like they were waiting for the other shoe to drop - i.e. some manager was going to come in and yell at them for not working as hard as possible. |
|
This is a task board the team put together to identify the tasks required to complete the stories in the WIP. The idea here was to let other people know what was remaining to be done so that team members could help each other out or at least not step all over each other. |
 |
 |
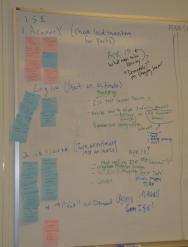
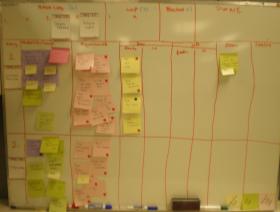
Here is the next evolution of the task board. The WIP stories are listed down the first column and the various internal states are the remainder of the columns. The sticky notes are the actual tasks that need to get done (color is meaningless). |
|
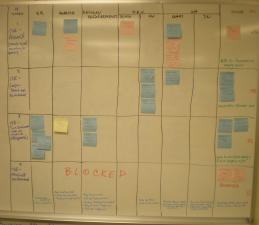
Here is a combination story task board from a different team. They chose to run the stories across the top row with spots for Backlog, WIP, Blocked and Done. The WIP stories get moved down to head the row just like the other team did. For this team they did use color and sticky dots to indicate various items, but honestly I've forgotten what them meant. |
 |
So where are we now? Interestingly things have been going smoothly for awhile so I had to wander over into the team spaces to be sure I remembered correctly. If you've followed along above you may have noticed that the boards got more complicated as we went. Since then we've been simplifying. Also we've gotten used to working this way and it turns out that if you work on a limited number of things, minimize multitasking and talk to each other there isn't much need to use up a big whiteboard with sticky notes.
That's right - we no longer have a kanban board. Now that isn't to say we've abandoned the concepts, we've just determined that we don't need the big visible board.
Currently tasks are being tracked in Extreme Planner and stories are being tracked in a spreadsheet by the project manager.
I use a parallel spreadsheet without all the gory details to help the stakeholder prioritized work, see what is in process and what various releases might look like.
In a way I schedule the entire department on a single 8.5 x 11 piece of paper that has its roots in our very first kanban board.
10/23/08
Throughput vs. Velocity
Throughput and velocity are ways of measuring how fast a team can do work. Knowing how fast a team is going allows the team and their stakeholders to know when something is going to be done.
What is Velocity?
Velocity (http://www.extremeprogramming.org/rules/velocity.html) is a commonly used metric for teams using Extreme Programming or Scrum as their guiding principles for software development. Velocity is a unit-less measure that tells the team how much work they should take on each iteration or sprint.
A simple example of calculating velocity:
At the first sprint planning meeting the team estimates the top 10 stories and believes that they can complete 6 of them in the next 2 weeks based on the following estimates.
|
Story |
Points |
|
A |
3 |
|
B |
5 |
|
C |
1 |
|
D |
5 |
|
E |
2 |
|
F |
1 |
|
Total |
17 |
At the end of 2 weeks stories A-E are complete and F is started, but not complete. This teams velocity is 16 point per iteration, or about 32 points per month. Note there is no credit for partially done work. The next iteration the team estimates stories until they have stories that add up to 16 points. At the end of the iteration they measure what was actually completed and repeat until the project is done.
Velocities cannot be compared across teams because velocity is derived from estimates created by the team and since no team estimates the same way it is impossible to compare them.
Velocity is also not a productivity metric. Wanting to see the velocity have a constant increase is like asking to increase the speed of light. Velocities do vary over time due to various factors (like the fact that software is complex), but tend to stabilize if the work and personnel are not fluctuating too much.
What is Throughput?
Throughput is not commonly used in software development, but is becoming more prevalent with the introduction of lean concepts. Throughput is most common when using a kanban scheduling board (http://blogs.consultantsguild.com/index.php/wayne/2008/02/01/no-more-iterations) to help manage the delivery of stories.
Throughput is the number of things that can be done in a given period of time.
A simple example of calculating throughput:
The team pulls the highest priority item off the backlog and works on it until they are done. They note when they started the story and when they finished it. They do this over and over until the project is over. Every month someone summarized the information about the stories that were completed.
|
Story |
Started |
Competed |
Duration |
|
A |
Jan 1 |
Jan 4 |
3 |
|
B |
Jan 4 |
Jan 12 |
8 |
|
C |
Jan 12 |
Jan 13 |
1 |
|
D |
Jan 13 |
Jan 25 |
12 |
|
E |
Jan 25 |
Feb 3 |
9 |
This team completed 4 stories in January so their throughput is 4 stories per month. Each story takes on average 6 days to complete with a standard deviation of about 5 days. So 90% of stories are completed in 6 days +/- 5 days. With additional data the standard deviation should tighten up unless you have large variance in story size on a regular basis. Even though story E was started in January we don't count it because it was not completed in January. It will go into February's stats.
Since throughput relies on actual start and finish times we can derive a predictive measure for forecasting without any estimating.
Note that duration ignores the fact that some days are weekends.
Like velocity throughput is a team specific number and cannot be compared across teams.
Challenges with Velocity
Velocity is based on an abstract unit such as Story Points (http://en.wikipedia.org/wiki/Story_points) that are not always easy to explain to stakeholders (or even the team sometimes). Stakeholders often want to know how many days a story point represents. Since story points are relative to each other there isn't a direct mapping, although many team do grudgingly come up with an equivalence. To get around this some teams estimate in ideal or engineering hours. Unfortunately the same questions get asked. "How do I convert your funny agile units into days?" See also http://www.think-box.co.uk/blog/2006/02/ideal-time-vs-story-points.html
Velocity also requires the team to spend time estimating the stories. I'm not sure I ever met a developer who enjoyed estimating and even with planning poker (http://en.wikipedia.org wiki/Planning_poker) most team member do what they can to get out of the estimating meeting yielding less than useful results. One team I know of estimated everything as "?" once they got tired.
As in all estimation the results are only as good as the information at hand. When you are estimating something you've never done before the accuracy can be all over the place.
Challenges with Throughput
The big knock against throughput is that it requires you to have relatively similar size stories in your backlog. This is true to a point. If your stories are not of a similar size your standard deviation will be larger leading to a larger range in your completion date predictions.
Which to Use?
In my context (stable teams working on product lines) I prefer the kanban/throughput combination. We don't have the dreaded planning meeting and we are still able to tell our stakeholders how many stories they should plan on having in the next release.
If you are currently using velocity it is very little overhead to start tracking throughput as a way to double check what your velocity metric is telling you.
08/21/08
Corey Ladas explains Scrum-ban
Cory has a great post titled: Scrum-ban | Lean Software Engineering. In it he describes how a team can take advantage of kanban within a Scrum environment.
08/07/08
Another New Bike
Previously I posted about my new V-Strom which is a nice bike. However, after taking it on something more difficult than gravel roads and compared to my wife's Honda CRF150 I knew I needed something much lighter, more dirt oriented, but could still be ridden on the street.
After much research I initially narrowed it down to the Kawasaki KLR 650, Honda RX650L and the Suzuki DR650. The KTM and BMW were out of the picture because of cost. My lingering concern was the weight of the 650s.
So what did I buy? A Kawasaki KLX250S!.

Why did you buy such a small bike after owning (and enjoying) those liter street bikes? Well, basically it was time spent riding the CRF150. I knew that the 250 would be able to take me anywhere I wanted to go, and it easily does the legal speed limit. What more do you need? (well actually I'm saving my pennies for a Ducati ST4 for my wife and I to do 2-up riding.)
The "Why To" Manual
Hank Wallace turned me on to a post by Allison Shapira where she summarizes a key point from Rob Walker's writeup of the Blue Man Group - the "Why To" manual.
This "Actors' Journal" is not so much a how-to manual as a why-to manual; it's not about stage directions, but rather tells the story of the show step by step, from the point of view of the Blue Men. As a decoding and deconstruction of Blue Man's at-times baffling, even mystical behavior, it's a fascinating document, thick with references to everything from Being There to George Bernard Shaw to Robert Motherwell to the caves of Lascaux. Some explanations are straightforward ? "The Blue Men are not aliens" ? and others are more subtle, as when the trio's harmonic "three as one" relationship is described in terms of "blesh," a mix of blend and mesh borrowed from Theodore Sturgeon's science fiction novel More Than Human.
What would a "Why To" manual look like for a development team?
Miško Hevery on Writing Testable Code
Miško Hevery has written a great summary of some basic coding rules for testability in his post Writing Testable Code.
I love this quote because every time I introduce unit testing to someone who has an existing code base you can see this in their eyes:
"I understand how to write tests for your code, but my code is different"
He goes on to list the rules most often broken by developers that make unit testing hard in his top ten list:
- Mixing object graph construction with application logic
- Ask for things, Don't look for things (aka Dependency Injection / Law of Demeter)
- Doing work in constructor
- Global State
- Singletons (global state in sheep's clothing)
- Static methods: (or living in a procedural world)
- Favor composition over inheritance
- Favor polymorphism over conditionals
- Mixing Service Objects with Value Objects
- Mixing of Concerns
03/17/08
New Bike!
I haven't posted much about my enjoyment of motorcycles, but yesterday I took the next step in my ongoing series of motorcycle experiences.

My new bike is a 2005 Suzuki DL1000 otherwise known at the V-strom. I'm looking forward to getting to know it a lot better. The previous owner put a lot of aftermarket farkles on it including heated grips (incredibility useful as it was 40F on the way home) and a custom seat which seems great so far.

For the last few years I've been riding this 1998 Ducati ST2, which has been a wonderful bike, but as I get older the position gets more uncomfortable the longer I go. And lets just say it is a tad expensive to maintain.

Back in the day I rode one of these to and from work. Things have sure changed.
03/04/08
12 Learnings From My First Turn As Startup CEO
Jason Goldberg has a great post on some of the things he learned while CEO of Jobster.com.
- The CEO's job is to create value.
- Try to ride some powerful existing waves vs. just creating new waves.
- Technology companies are all about the product.
- Related to #3, the rapid iteration model (ship early, learn from usage, adjust) works well for consumer services but works not as well for B2B services.
- Hire people who are passionate about the specific problems you are trying to solve.
- You must get close to your users and customers and live their personas.
- The value of your company is directly related to your capital efficiency.
- In the early days, I highly recommend that you force your startup to be resource constrained.
- Don't listen to outsiders who tell you to go faster and ramp sales and marketing.
- Avoid field sales in favor of telesales.
- Once you are in the market and have established some measurable and repeatable levels of success, #11 negates #8 on this list.
- Have fun.
03/03/08
Ten Reasons High-Tech Companies Fail
Planning on starting your own company? Here are some good points to consider from High Tech Strategies - Ten Reasons High-Tech Companies Fail
- Lack of Market Focus
- Excessive Pace of Product Improvement
- Incomplete Products
- Undifferentiated Products
- Channel Mismanagement
- Failure to Establish the Right Competitive Barriers
- Using Price Alone To Drive Market Transformation
- Improper Use of Advertising
- Misinterpretation of the Technology Adoption Lifecycle Model
- Irrelevant Market Research

Recommended Books
- Implementing Lean Software Development: From Concept to Cash (The Addison-Wesley Signature Series)
- Lean Software Development: An Agile Toolkit for Software Development Managers
- Agile Software Development with SCRUM
- Agile Project Management with Scrum (Microsoft Professional)
- Agile Management for Software Engineering: Applying the Theory of Constraints for Business Results
- Agile Retrospectives: Making Good Teams Great
- Software by Numbers: Low-Risk, High-Return Development

